How do I use the Heatmaps tab?
The Heatmap tab provides a visual overview of average scores and engagement across your campaign, broken down by up to three attributes.
From the Heatmap tab, you can:
-
View average scores by attribute
-
View engagement levels by attribute
-
Change attribute breakdowns and add additional ones
-
Change the display order of attributes
1. View average scores levels by attribute
-
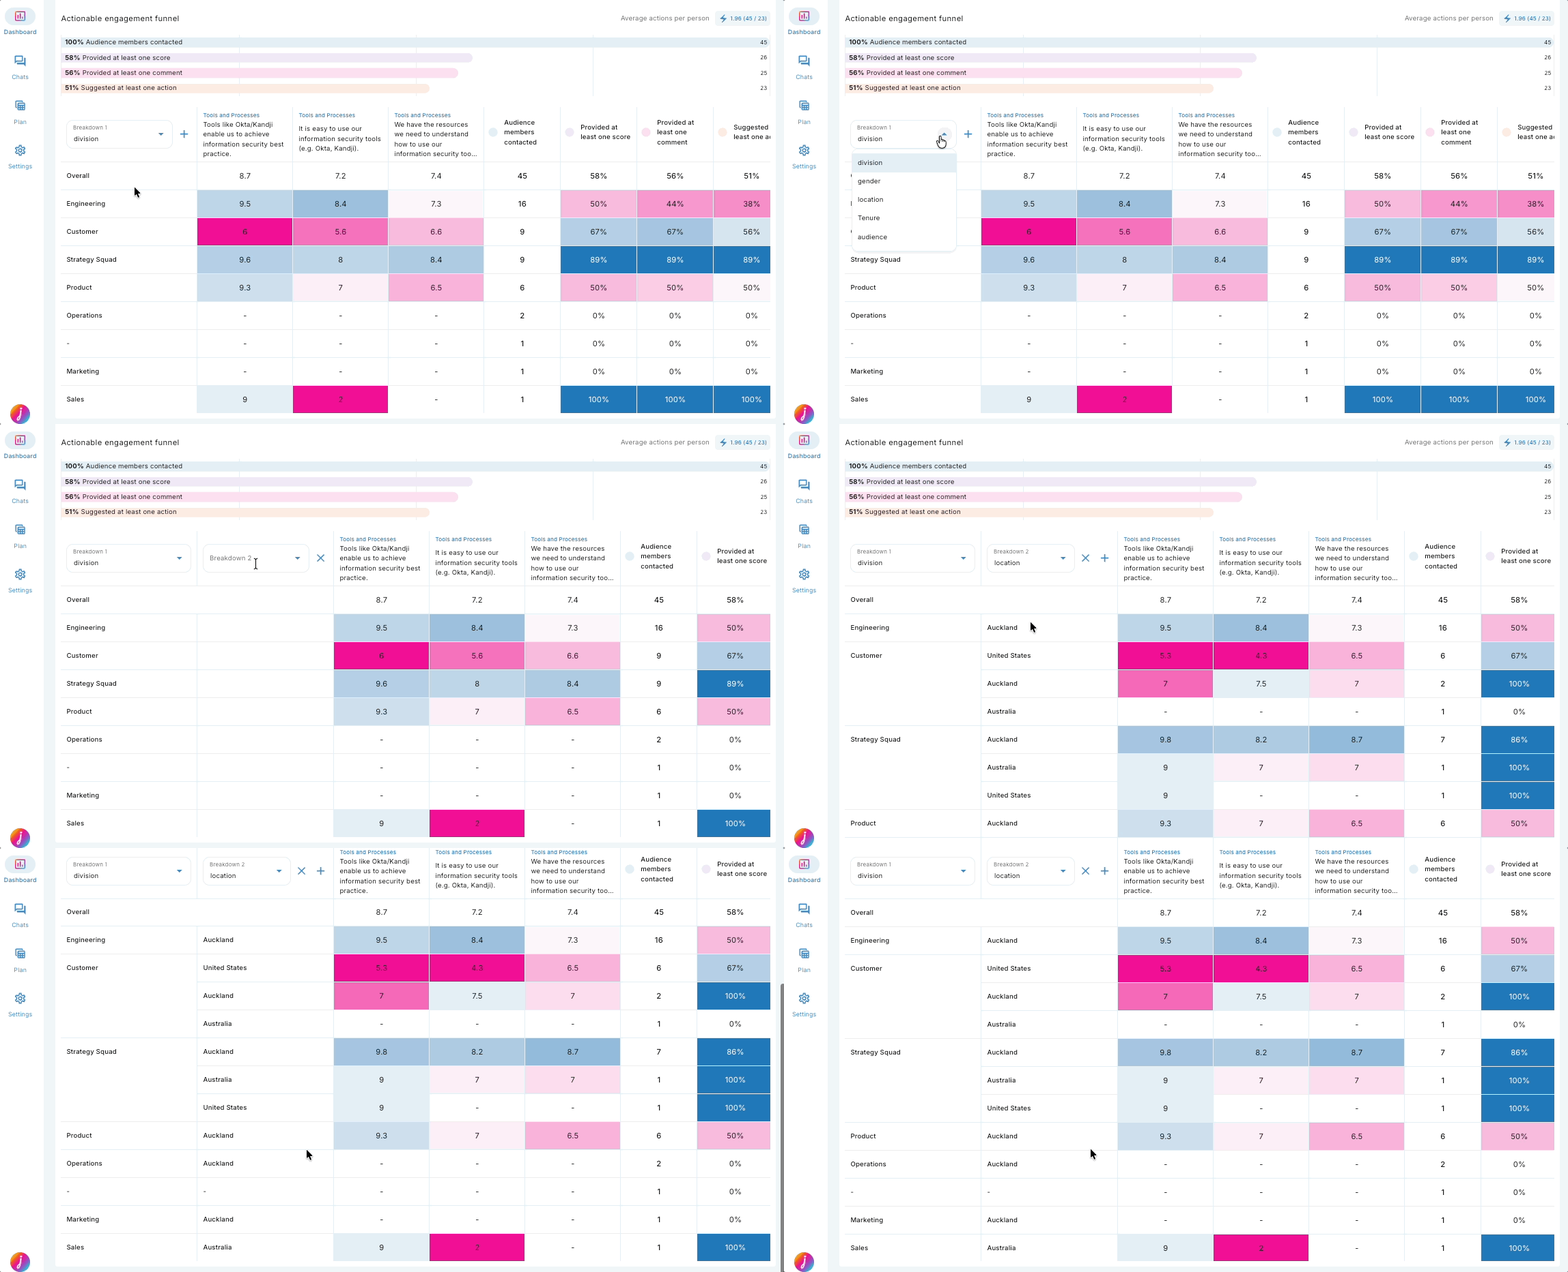
The Heatmap displays a table with attributes (e.g., teams or departments) in rows and rated statement questions in columns.
-
The top row, labelled Overall, shows average scores across all responses visible to you.
-
Rows below show average scores for each breakdown.
-
Colors indicate variance from the overall average score:
-
Darker blue = higher average score than the overall average
-
Darker pink = lower average score than the overall average
-
2. View engagement levels by attribute
-
To the right of the sentiment scores, you’ll see engagement metrics for each attribute. These include:
Engagement funnel metrics
-
Audience Members Contacted – Total contacted in that group
-
Provided at least one score – % who rated at least one statement (standard participation metric)
-
Provided at least one comment – % who left at least one comment
-
Suggested at least one action – % whose comment included an actionable phrase
Additional engagement metrics
- Provided at least one score - Number of people who rated at least one statement
-
Got a reply – % who were responded to by a person or AI
-
Commented after reply – % who commented again after receiving a reply
-
Suggested an action after a reply – % who left an actionable phrase in a follow-up comment
-png.png?width=670&height=156&name=Score%20Heatmap%20-%20Actionable%20Campaign%20(6)-png.png)
3. Change attribute breakdowns and add additional ones
-
To change the breakdown, click the Breakdown dropdown in the top left of the tab and select a different attribute.
-
To add another breakdown, click the + icon next to the dropdown. You can add up to three breakdowns in total.
-
This lets you layer insights, such as division and location.
4. Change the display order of the attributes
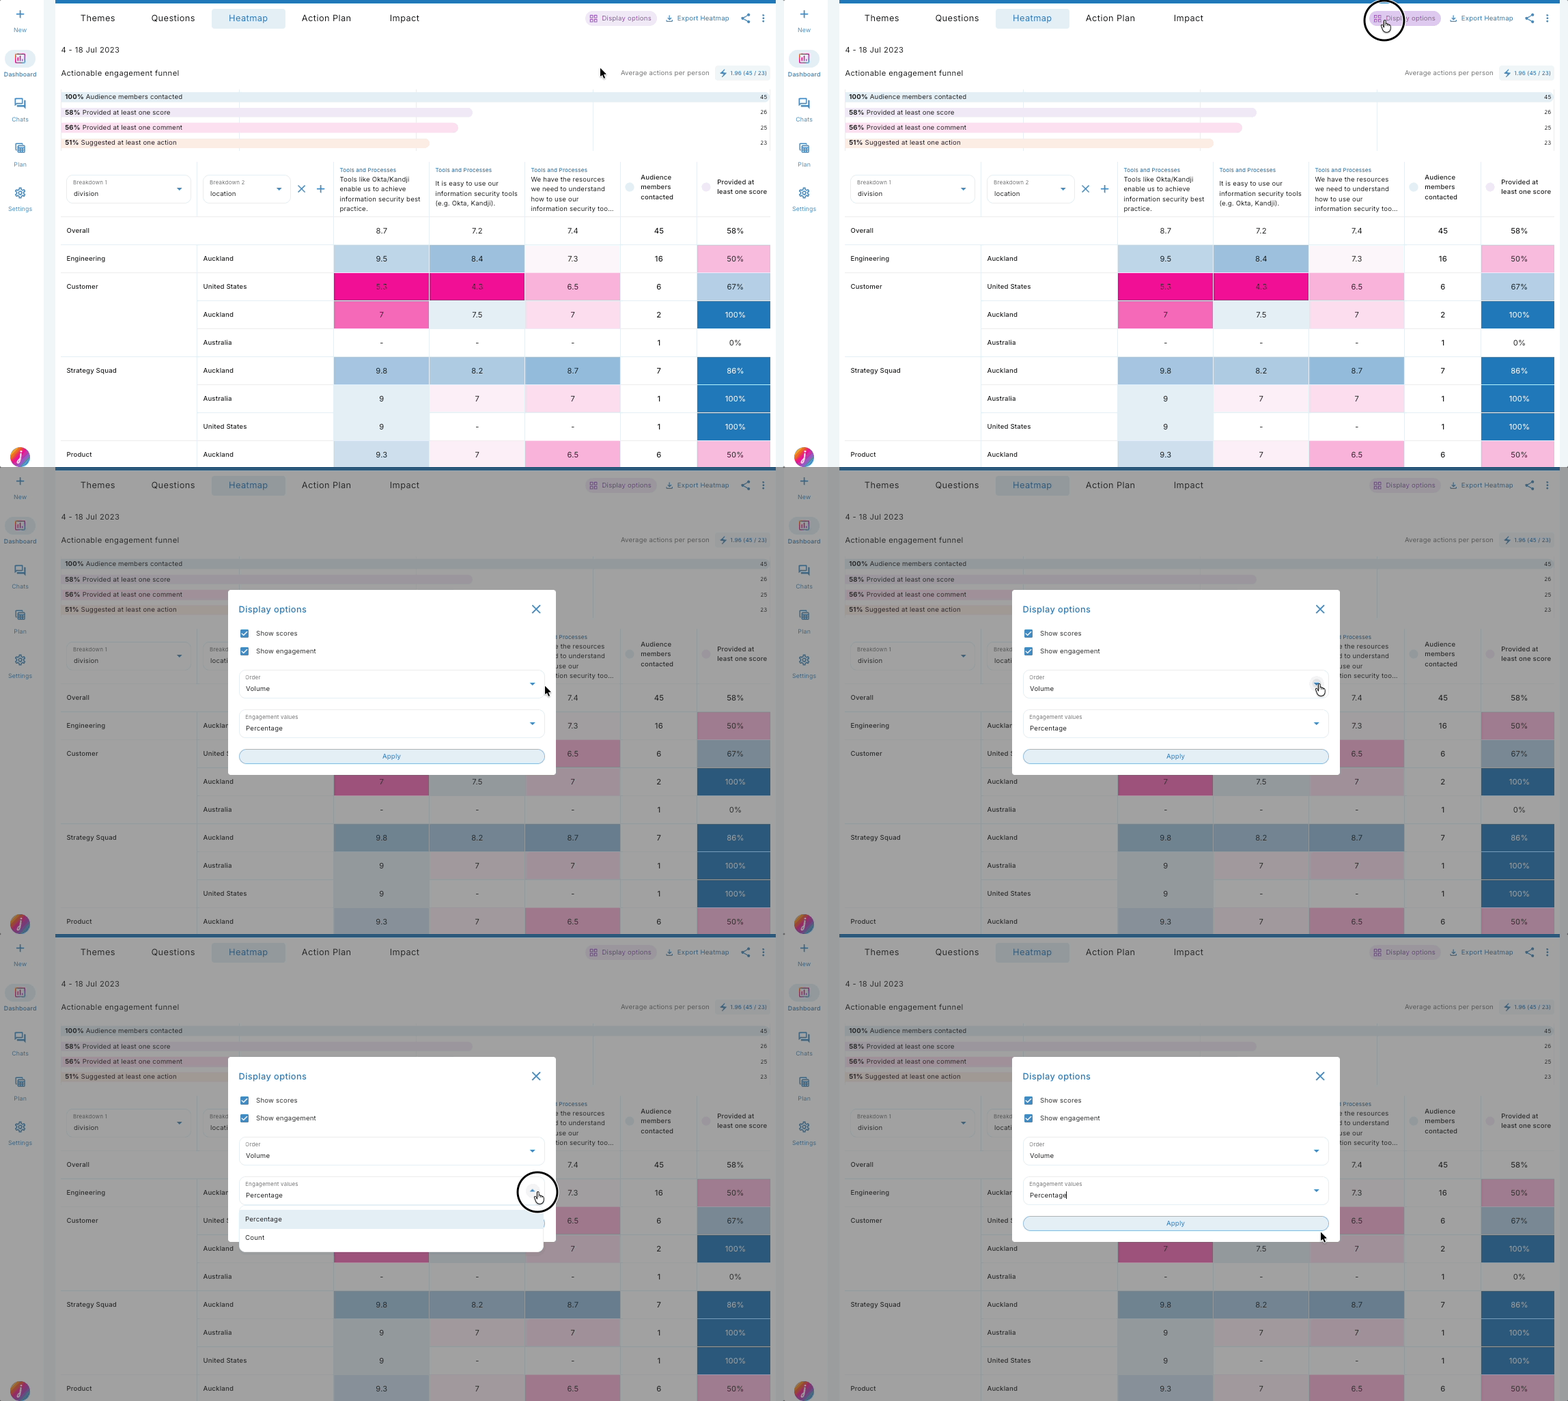
- Use the Display Order option in the top right to reorder attributes:
-
From here you can choose to show:
- Only average scores, only engagement metrics, or both
- Volume – Sorts by number of people in each attribute group (largest to smallest)
-
-
Alphabetical – Sorts attribute names from A to Z
-
-png.png?width=618&height=387&name=Score%20Heatmap%20-%20Actionable%20Campaign%20(7)-png.png)

