The 'Overview' card lets you see campaign details, top actionable themes, and the average score breakdown for a selected campaign.
The Dashboard Overview card is a great way to see overall campaign results at a glance. Within the Overview card, you'll be able to:
- View campaign details
- View top actionable themes for a campaign
- View 'Average score breakdown' by [attribute] for a campaign
1. View campaign details.
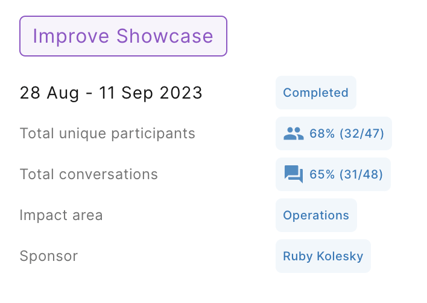
The campaign details outline:
- Campaign name
- Campaign dates and status
-
Total unique participants: The number of unique people who answered at least one question in the campaign, as a percentage of the total audience count.
-
Total conversations: The percentage of conversations that turned into two-way chats (conversations that have both audience and facilitator comments).
-
Impact area / Category
- Sponsor
2. View top actionable themes for a campaign.
- Click 'Show more' to see all of the top actionable themes for a campaign
- Hover over a theme and click 'View theme'. This will take you to the themes tab, where you can see any sub-themes and actionable phrases linked to the themes
3. View 'Average score breakdown' by [attribute] for a campaign
- Click the average score breakdown dropdown and select the attribute you'd like to apply. This will change the attribute in the overview card and question cards below.
- Hover over an attribute value till three dots appear. Click 'View conversations'. This will take you to the Live Feed with the attribute value applied.
- Hover over an attribute value till three dots appear. Click 'Filter dashboard'. This will apply the attribute value to the filter bar in the Dashboard and show you data relevant to that attribute value.
